💡 Good to know: Before you begin, make sure you have installed our pixel on your e-commerce site
Find more information in this article:
[Shopify] How to connect your dashboard?
How to connect your dashboard with your Shopify?
Track your credit usage in real time by hovering your mouse over the impressions circle. You'll also be able to see the credits you have purchased there.
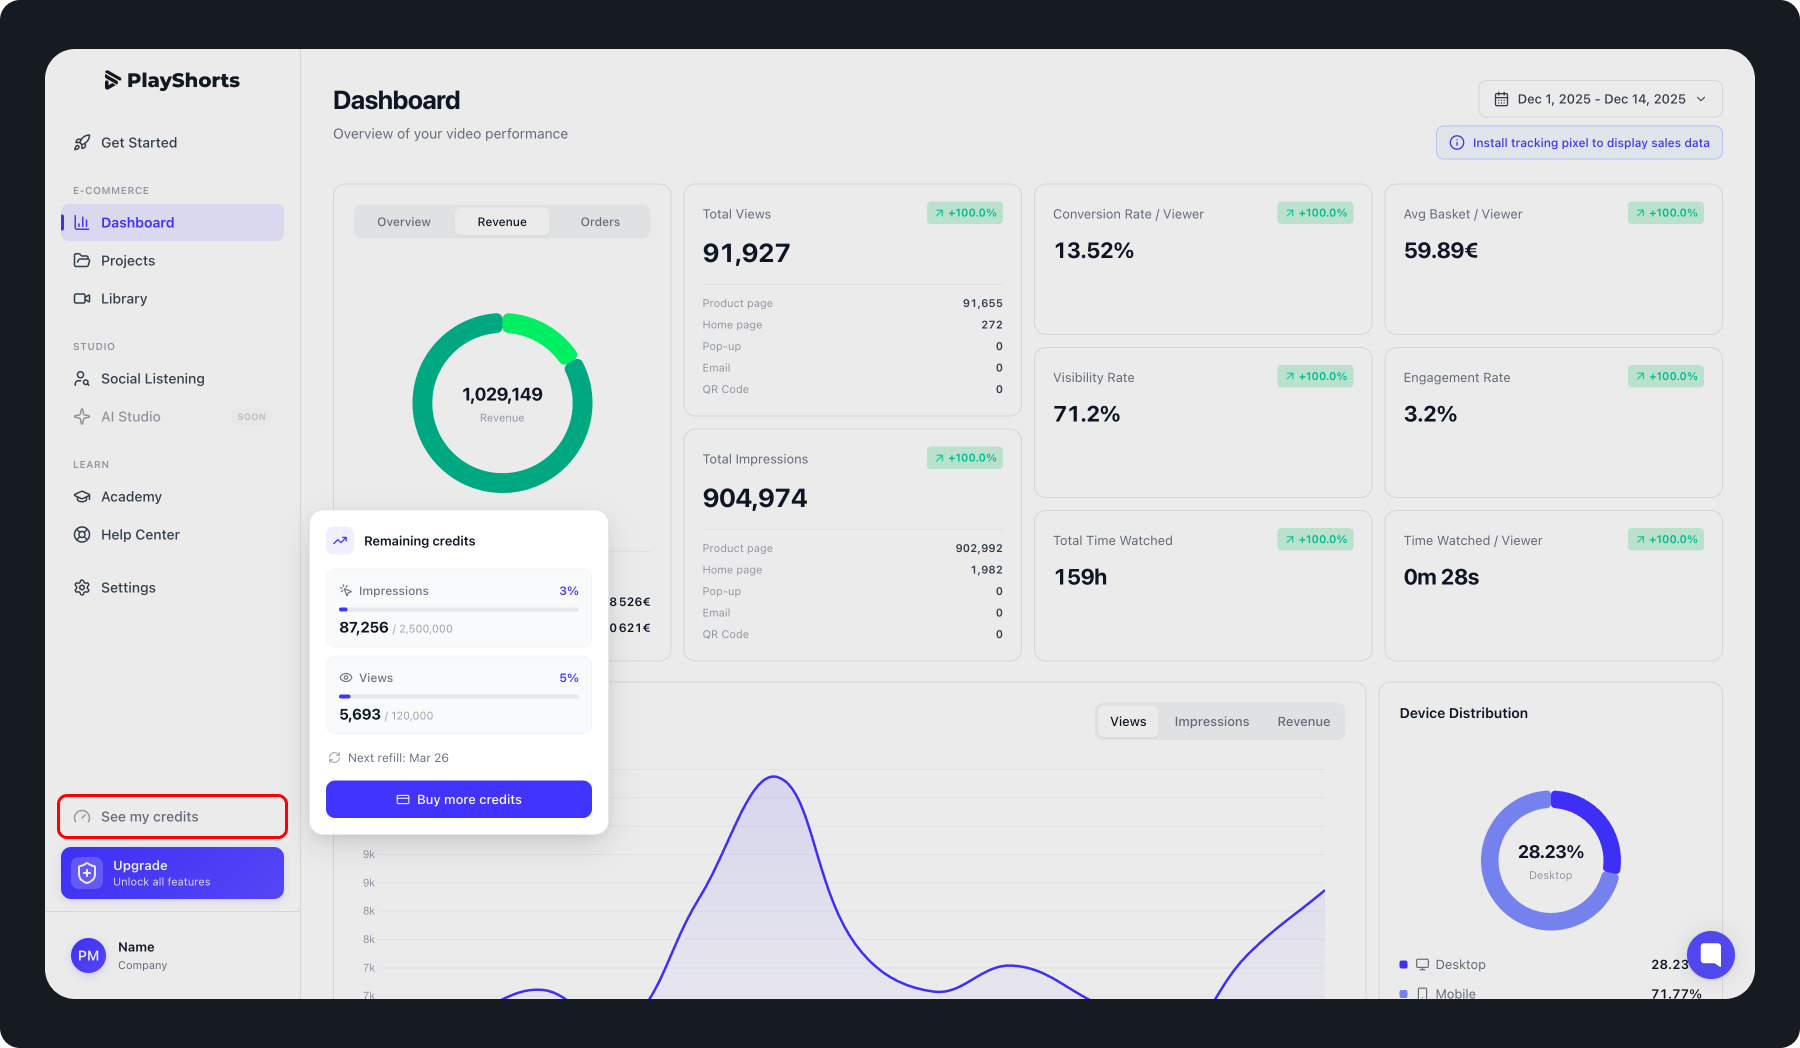
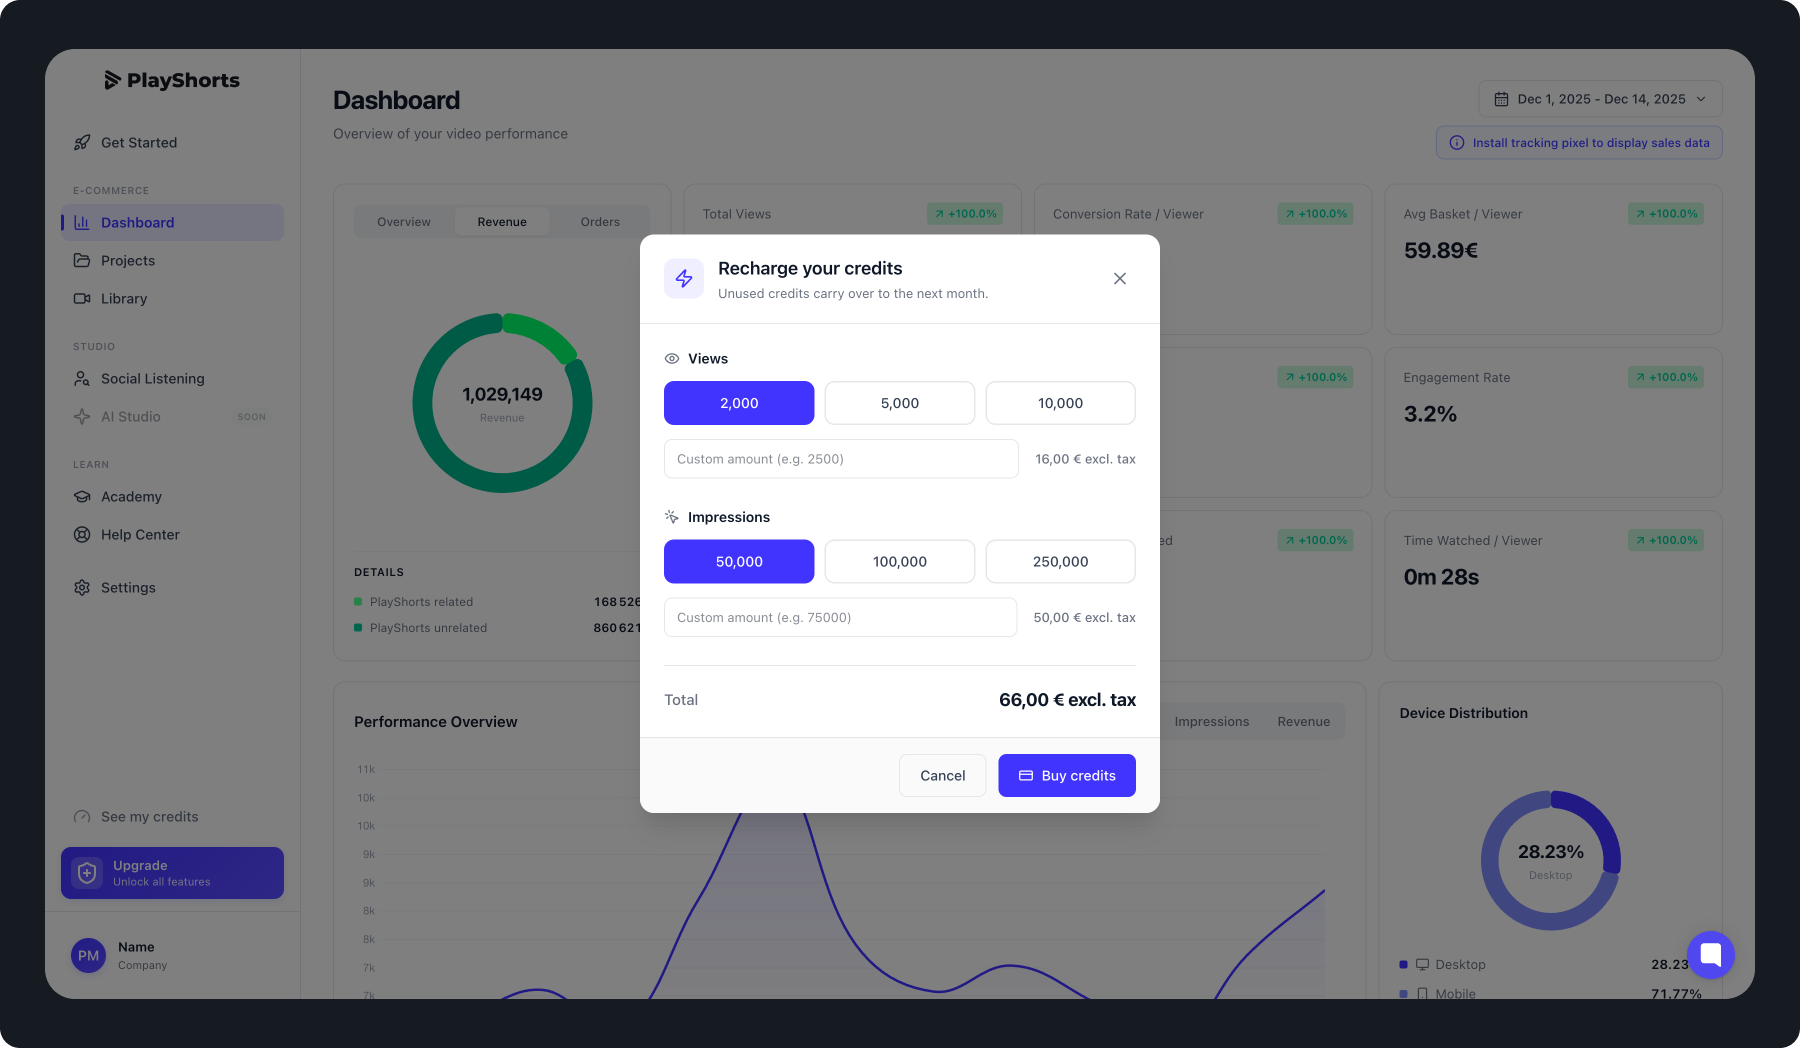
Buy print or view credits by clicking on "Buy more credits."
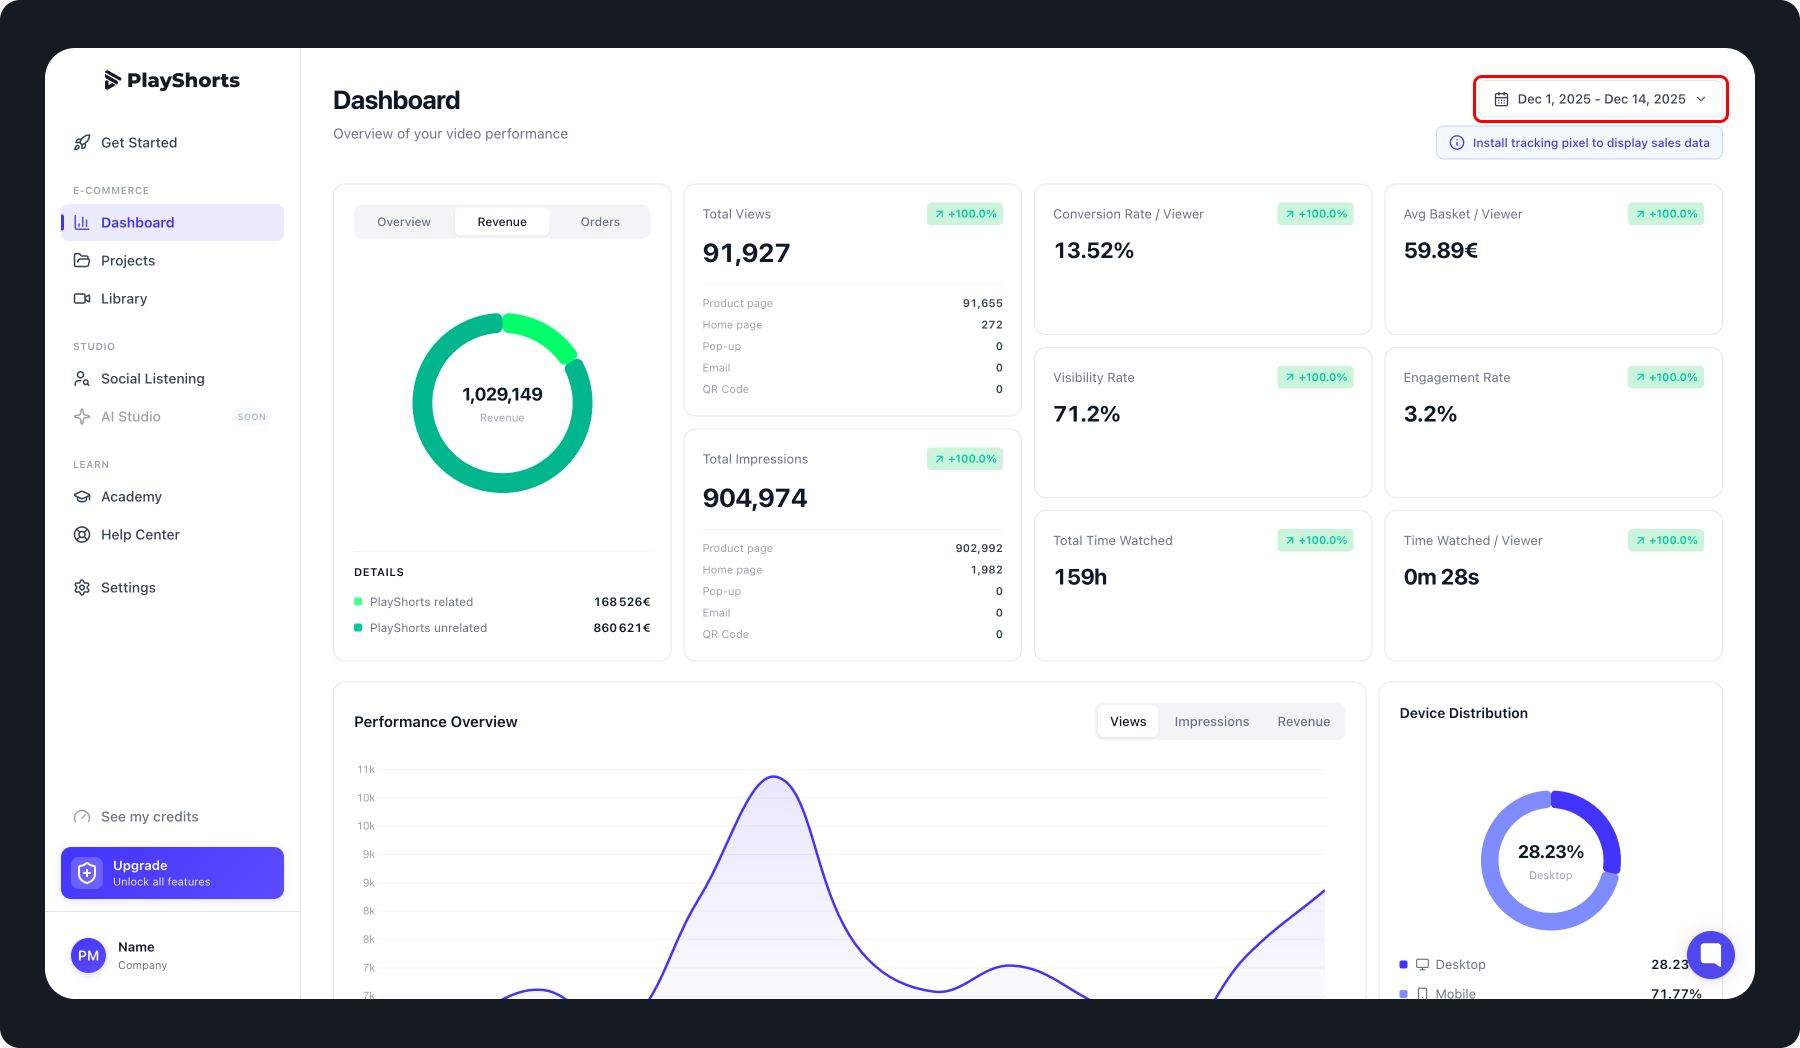
Adjust the dashboard dates to view your data for the desired time periods.
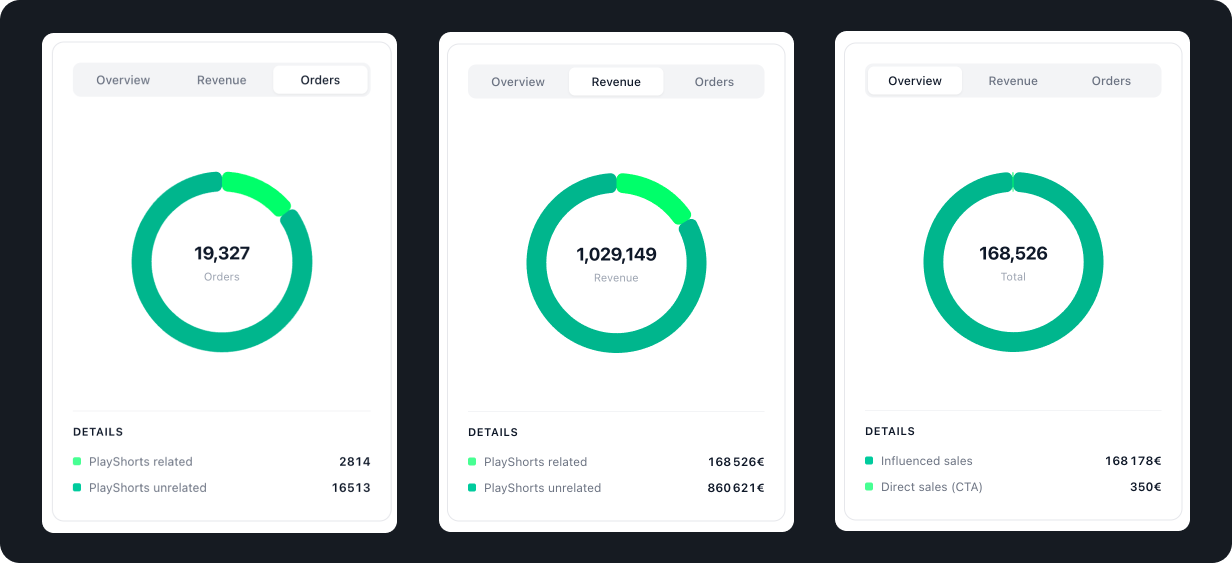
Overview
Find all the sales generated through PlayShorts.
Influenced Sales: Revenue generated by visitors who watched at least one video and made a purchase via your "Add to Cart" button during the same session.
Direct Sales (CTA): Revenue generated by visitors who watched a video and made a purchase by clicking on a call-to-action integrated within your videos.
Revenue
View all the revenue from your store.
PlayShorts unrelated: Revenue generated without the involvement of PlayShorts videos.
PlayShorts related: Revenue generated with the involvement of PlayShorts videos.
Orders
View all the orders from your store.
PlayShorts unrelated: Orders made without the involvement of PlayShorts videos.
PlayShorts related: Orders made with the involvement of PlayShorts videos.os PlayShorts
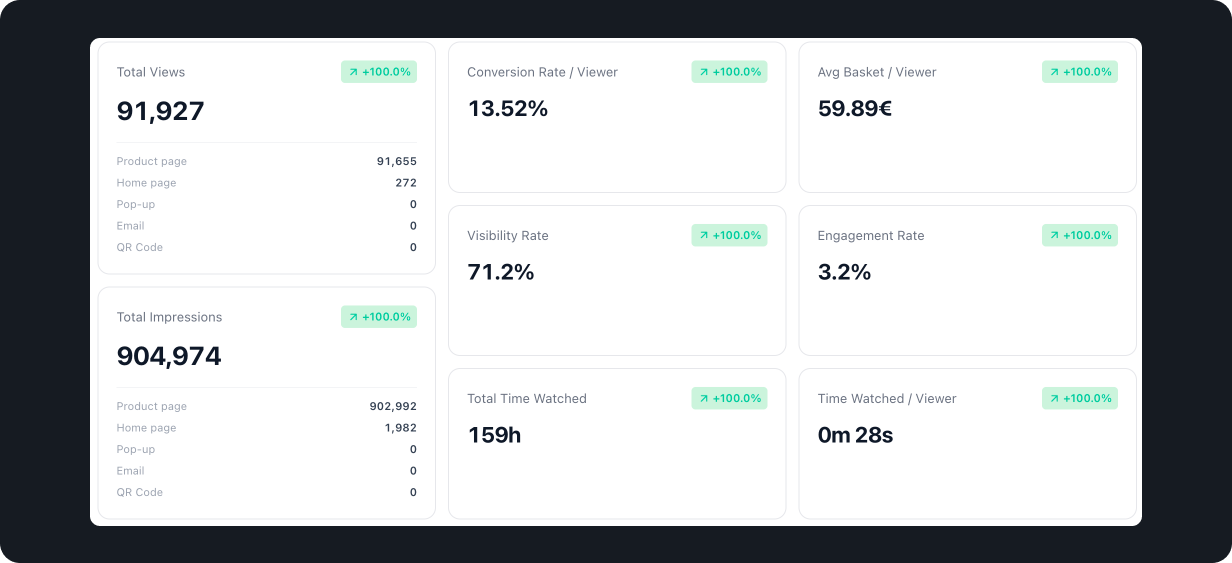
Total views: Indicates the total number of views for your videos based on the selected dates.
Total impressions: Indicates the number of times your videos appear on your pages, whether they are watched or not, based on the selected dates.
Conversion rate / viewers: The average conversion rate for customers who watched the videos on your store based on the selected dates.
Visibility rate: The average number of times your stories were viewed by your visitors based on the selected dates.
Total watched time: The total watch time on your videos based on the selected dates.
Avg basket / viewer: The average cart value for customers who watched at least one video based on the selected dates.
Engagement rate: The average number of clicks on your stories by your visitors based on the selected dates.
Time watched / viewer: The average watch time per customer who watched videos, based on the selected dates.
Good to know : 💡
If you want to improve your engagement rate, it's important to have a good visibility rate so that your customers click on your videos.
Find more information in this article:
[Shopify] Improve my visibility rate
Find out how to increase the visibility of your videos on your e-commerce site.
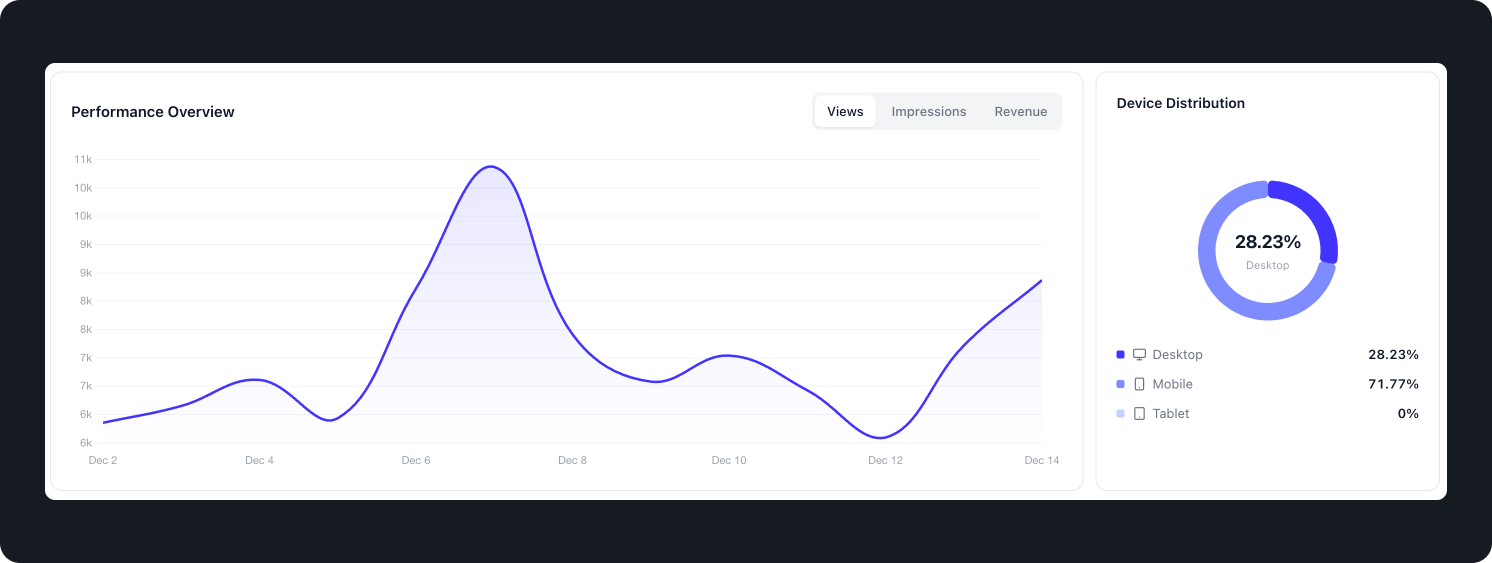
Get an overview of your views, impressions, or revenue through a summary table. You can also analyze the distribution of impressions of your videos based on the devices used by your visitors.
Good to know : 💡
If you notice that many of your customers are using their mobile devices to visit your website, consider placing your videos above the mobile fold. This will help you achieve a better engagement rate.
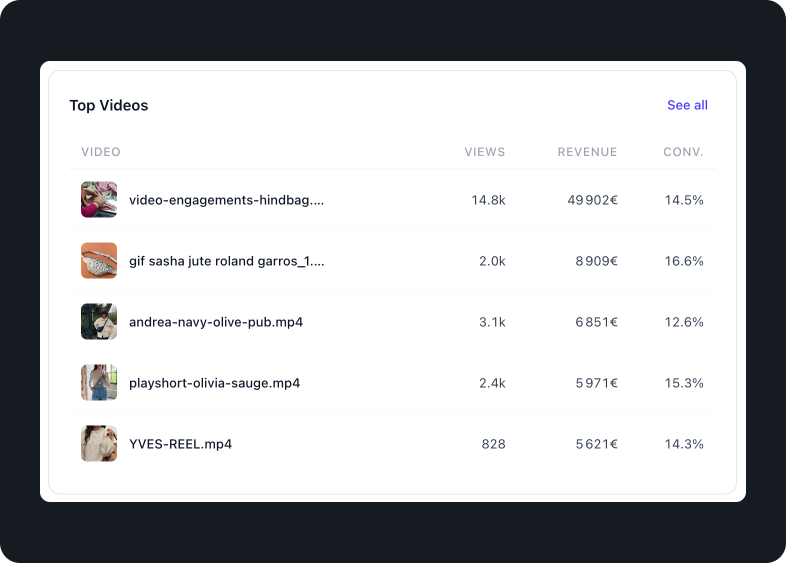
Views: Indicates the total number of views for your video based on the selected dates.
Total revenue: Shows the total revenue generated by your video based on the selected dates.
Influenced sales: Revenue generated by visitors who watched your video and made a purchase via your "Add to Cart" button during the same session.
Direct sales (CTA): Revenue generated by visitors who watched a video and made a purchase by clicking on a call-to-action integrated into your video.
Conversion: The average conversion rate for customers who watched your video, based on the selected dates.
Avg watch time: The average watch time of your video by users.
Hook performance: Measures the effectiveness of the hook by calculating the percentage of viewers who watched beyond the first 3 seconds of your video.
Less than 20% = Poor hook
20% to 30% = Average hook
More than 30% = Good hook
Video performance: The percentage of people who watched your video for up to 15 seconds or the entire video for videos shorter than 15 seconds.
Less than 20% = Low engagement
20% to 40% = Moderate engagement
More than 40% = High engagement
Related project: The name of the project to which the story is associated.
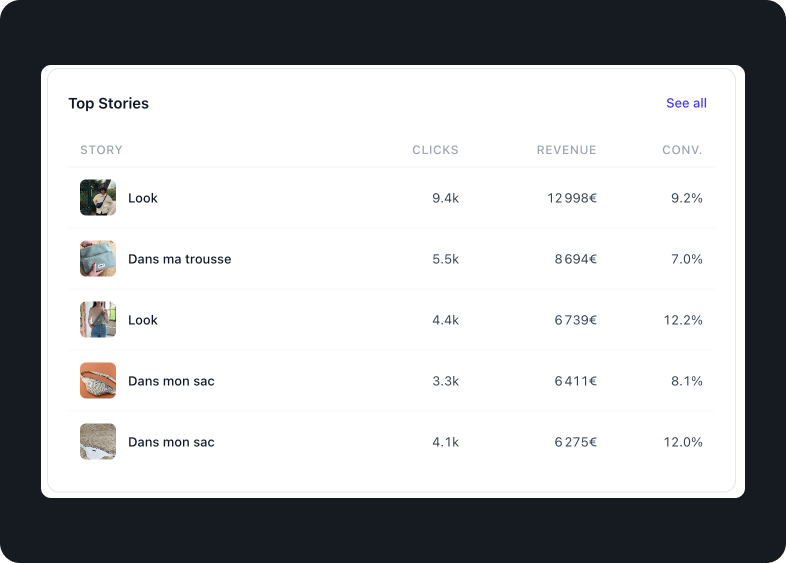
Views: Indicates the total number of views for your story based on the selected dates.
Total revenue: Shows the total revenue generated by your story based on the selected dates.
Influenced sales: Revenue generated by visitors who watched your story and made a purchase via your "Add to Cart" button during the same session.
Direct sales (CTA): Revenue generated by visitors who watched your story and made a purchase by clicking on a call-to-action integrated into one of your videos.
Conversion: The average conversion rate for customers who watched your story, based on the selected dates.
Click rate: Indicates the average click rate on your story once it becomes visible to your visitors.
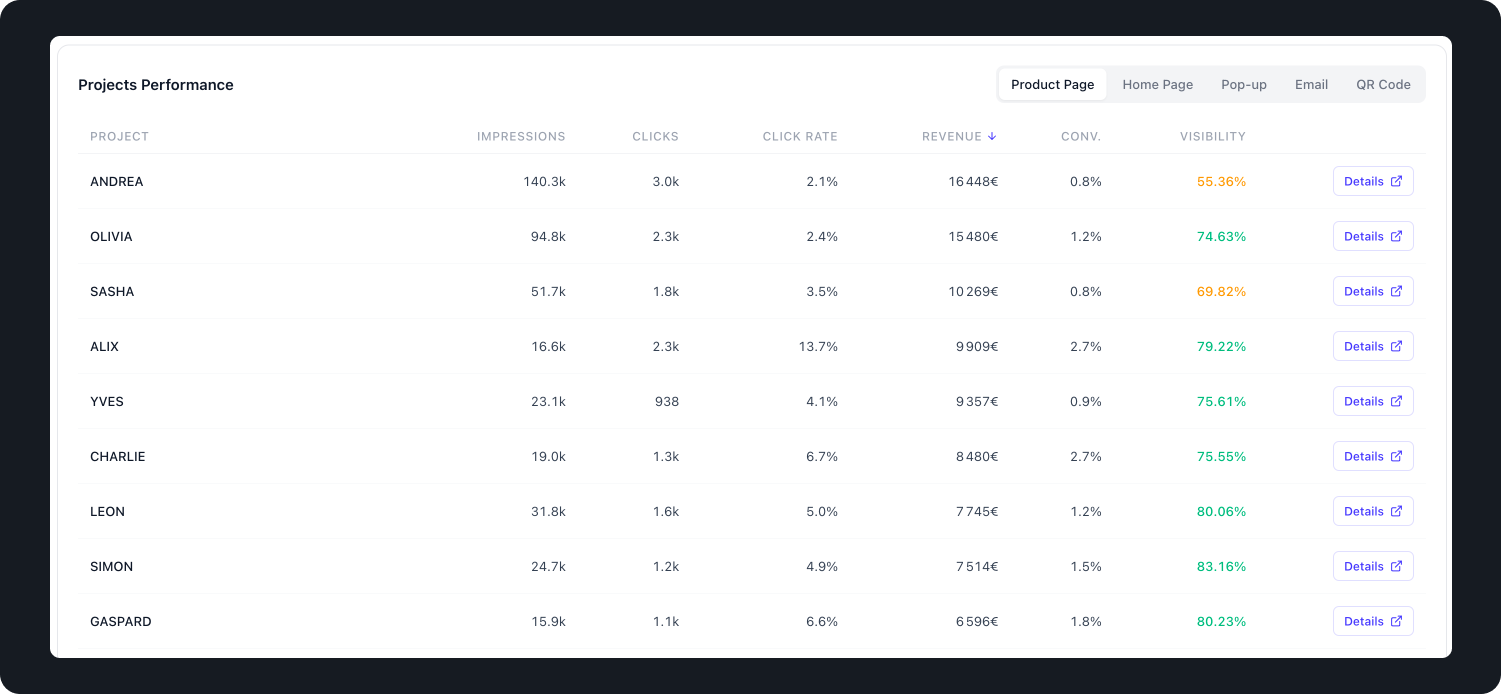
Impressions: Indicates the total number of times your videos were loaded on your webpage.
Clicks: Indicates the total number of clicks on your project once your videos were displayed on your webpage.
Click rate: The average click rate on your stories by your visitors.
Revenue: Shows the total revenue generated by your project based on the selected dates.
Conversion: The average conversion rate for customers who watched your project, based on the selected dates.
Visibility rate: The average number of times your stories were visible to your visitors.
Find out more on this subject with this article:
[Shopify] Improve my visibility rate
Find out how to increase the visibility of your videos on your e-commerce site.